Demystifying Vibration Monitoring Part 4: Diagnosing Imbalance, Misalignment, Looseness, and Bearing Wear
Quick Access
Part 1: Why Vibration Monitoring Matters—And How It Works
Part 2: Vibration Analysis Principles on Rotating Machines
Part 3: Identifying and Interpreting Overall Vibration and Fault Patterns
Part 4: Diagnosing Imbalance, Misalignment, Looseness, and Bearing Wear
The Four Most Common Machine Faults
Every machine component produces a unique vibration signal. Signals displayed in the spectrum often form characteristic patterns. Pattern recognition is a key part of vibration analysis, but significant training and experience are necessary to recognize and read the patterns.
Don’t waste time analyzing the hundreds of rare machine faults when 90% of the time rotating machines suffer from four common faults—misalignment, imbalance, looseness, and bearing wear.
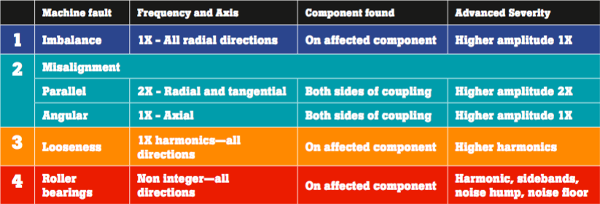
Summary Table of Four Most Common Faults
Below is a simplified overview of the patterns used to recognize the four most common machine faults.
Imbalance
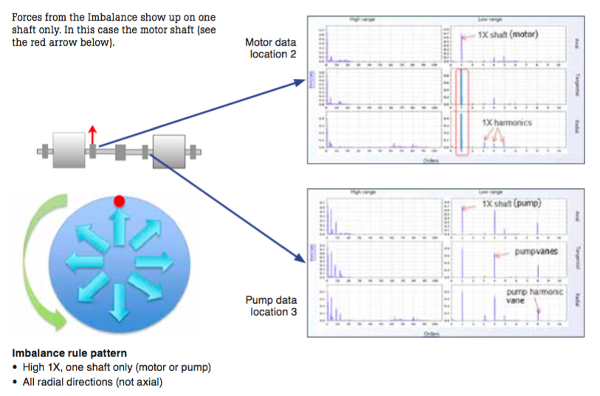
An imbalance is a heavy spot on the shaft causes forces in all radial directions that lead to excessive vibration and increases the wear of bearings, seals, etc. See Figure 2 below.
Misalignment
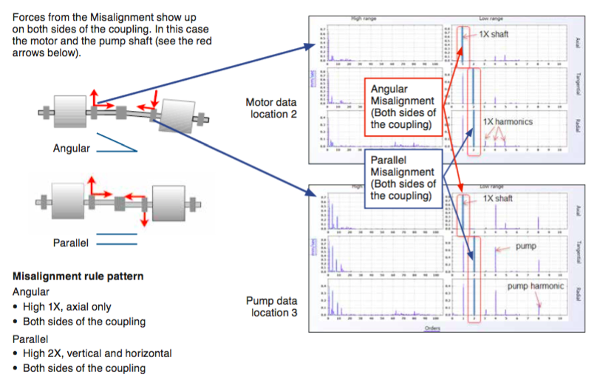
Misalignment is when the axes of rotation of two shafts are not collinear when the machine is running under normal operating conditions. This causes forces that lead to excessive vibration and increases the wear of bearings, seals, etc. See Figure 3 below for details.
Looseness
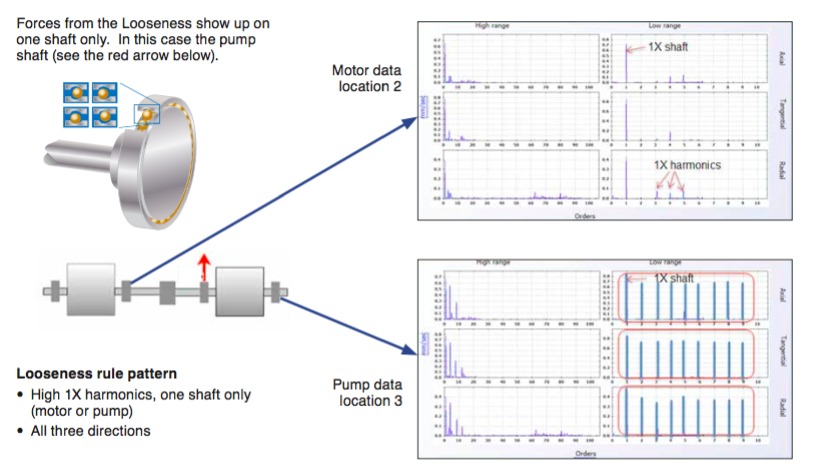
Looseness is when the shaft, foundation, or a component has become loose which causes forces that lead to excessive vibration and increases the wear of bearings, seals, etc, like in Figure 4.
Bearing failure
Bearings will wear from excessive loads, other machine faults, poor lubrication or installation, etc. If not corrected, the bearings will eventually fail, and the Figure 5 shows what that looks like:
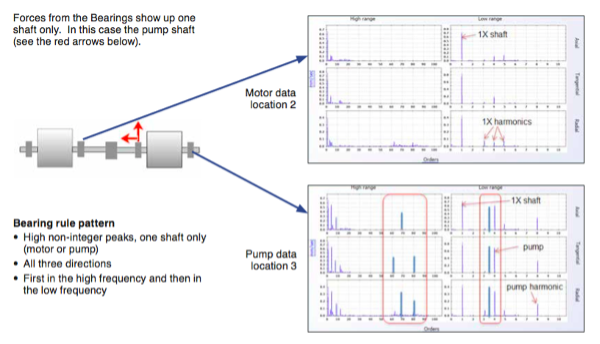
Why Bearing Frequencies are Non- Synchronous (Non-Integer Peaks)
The geometry of the balls, cage, and races show up at different speeds—not a multiple of shaft speed. This means that non-synchronous peaks are typically from roller bearings. Many vibration programs need four bearing frequencies to diagnose bearing faults: Inner race, Outer race, Cage, and Ball Spin (see Figure 6). One of the exceptions is Flukes 810, which uses automated pattern recognition.
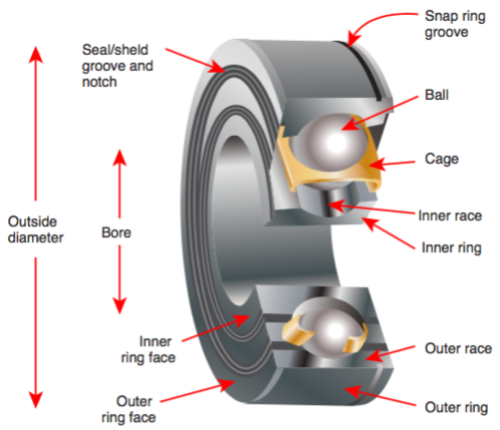
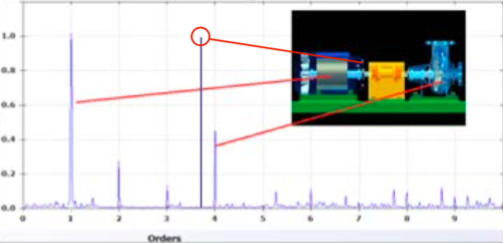
Figure 7(below) is an example of a bearing fault.
Notice vibration peak from the shaft is at 1X. If the machine has four pump impeller vanes, a smaller peak will show at 4X.
But, what is the large peak at 3.56X? A machine can’t have 3.56 fan blades or 3.56 pump vanes. This is probably from a roller bearing.
Understanding the Severity of Four Common Faults
The severity of the four common faults can be tracked over time based on the history from hundreds of thousands of machines that have been analyzed by many vibration experts over 30 years.
This knowledge and experience has been incorporated into rule-based algorithms and a baseline database that have been proven to be effective on standard rotating machines—motors, pumps, fans, compressors, blowers, and single shaft spindles.
The progression of machine faults has been analyzed for each machine class and each fault, and patterns have emerged that allow the diagnostic program inside a vibration tester to accurately diagnose the severity of each fault. Below is how an experienced analyst would manually analyze the data – although, remember that a tester like Fluke’s 810 does all of this for you automatically.
Progression of Imbalance: Watch Severity as it Gets Worse
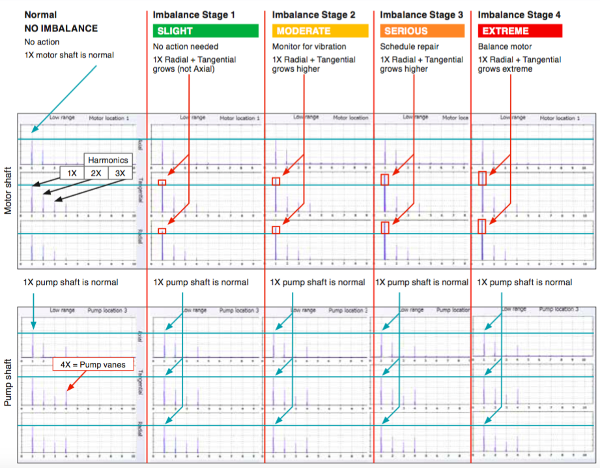
A heavy spot on the shaft causes forces in all radial directions that lead to excessive vibration and increases the wear of bearings, seals, etc. Indications of imbalance are pretty straight forward: higher than normal 1X (shaft) vibration in the radial and tangential direction.
Since 1X is best seen in the low range, look for Imbalance by comparing the 1X peaks in the low range. If the 1X peaks grow over time in the radial and/or tangential directions, but not axial, then the fault is imbalance.
The severity is determined by the amount of amplitude of the 1X peak over the baseline.
Watch the fault severity progress in each stage of imbalance and note the repair action suggested in Figure 8 below.
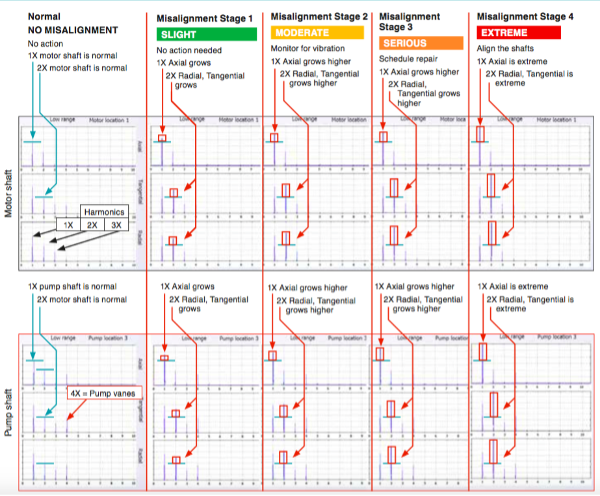
Progression of Misalignment: Watch Severity as it Gets Worse
The axes of rotation of two shafts are not collinear when the machine is running under normal operating conditions. This leads to excessive vibration and increases the wear in bearings, seals, etc.
Indications of misalignment are fairly straight forward. They include higher than normal 1X (shaft) vibration in the axial direction and 2X radial/tangential direction.
The increased peaks will be seen on both the motor and pump locations because misalignment is between the two shafts.
Since the 1X and 2X peaks are best seen in the low range, look for misalignment by comparing the 1X and 2X peaks in the low range. If the peaks grow over time, then the fault is misalignment.
The severity is determined by the amount of amplitude over the baseline.
Watch the fault severity progress in each stage of misalignment and note the repair action suggested in Figure 9.
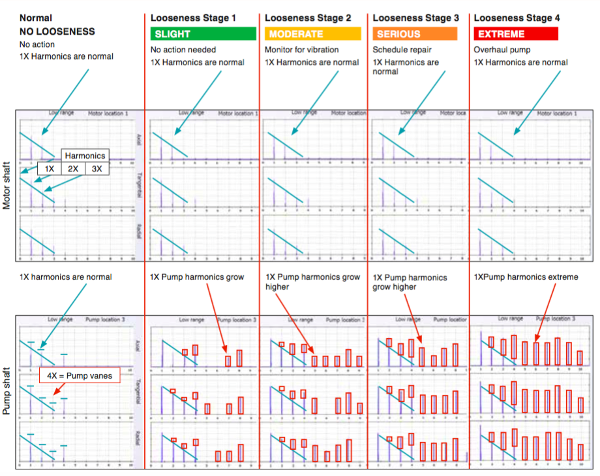
Progression of Looseness: Watch Severity as it Gets Worse
The shaft, foundation, or a component has become loose which causes forces that lead to excessive vibration and increases the wear in bearings, seals, etc.
Indications of looseness are fairly straight forward. They include higher than normal 1X harmonics in any direction. Since these harmonics are best seen in the low range, look for looseness by comparing the 1X harmonics in the low range.
If the 1X harmonics grow over time in any or all directions, then the fault is looseness. The severity is determined by the amount of amplitude of the 1X harmonics over the baseline.
Watch the fault severity progress in each stage of looseness and note the repair action suggested in Figure 10 below.
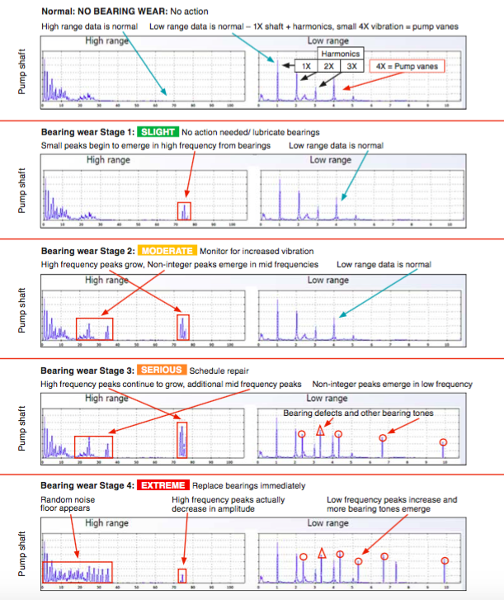
Progression of Bearing Wear: Watch Severity as it Gets Worse
Indications of bearings can come and go. One month they are present and the next they are not. We all know that bearings don’t get better.
Keep this in mind when diagnosing bearing faults. Look for non-integer peaks in any direction. Watch bearing fault severity progress in each stage of bearing wear and note the repair action suggested (see Figure 11). Note: motor data is normal.
Bearing wear is usually caused by other factors acting on the bearings. If your bearings are failing prematurely, you might want to look at other low-level faults in your machine such as imbalance, misalignment, or looseness. For example, moderate misalignment may or may not increase in severity over time, but the effects of misalignment will add to the stress on bearings and seals over time.
Be sure that the tester that you are using displays all of the faults found in a machine so that you can see potential candidates for root cause failure. Even if misalignment is not extreme, it should still be diagnosed and corrected soon to avoid collateral damage to bearings and seals.
Conclusion: From Vibration Signals to Smarter Maintenance
Across this series, we’ve broken down how vibration works, what it reveals, and how it ties directly to the most common faults in rotating equipment. But the real takeaway is this:
Vibration monitoring gives maintenance teams the right signal at the right time.
It’s early enough to plan and act, but focused enough to avoid noise and false positives. It scales from simple screening tools to advanced diagnostic systems—and it meets technicians where they are, whether they’re identifying issues or confirming root causes.
As teams are tasked with maintaining more equipment using fewer resources, vibration becomes more than a measurement. It becomes a strategy.
With the right tools and a clear understanding of what vibration is telling you, you can move from reactive repairs to condition-based planning—and keep your assets running longer, with fewer surprises.
Author Bio: John Bernet is a Mechanical Application and Product Specialist at Fluke Corporation. Using his 30-plus years of experience in maintenance and operation of nuclear power plants and machinery in commercial plants, John has worked with customers in all industries implementing reliability programs. He is a Certified Category II Vibration Analyst and a Certified Maintenance Reliability Professional (CMRP), with over 20 years of experience diagnosing machine faults.


