Demystifying Vibration Monitoring Part 2: Vibration Analysis Principles on Rotating Machines
Quick Access
Part 1: Why Vibration Monitoring Matters—And How It Works
Part 2: Vibration Analysis Principles on Rotating Machines
Part 3: Identifying and Interpreting Overall Vibration and Fault Patterns
Part 4: Diagnosing Imbalance, Misalignment, Looseness, and Bearing Wear
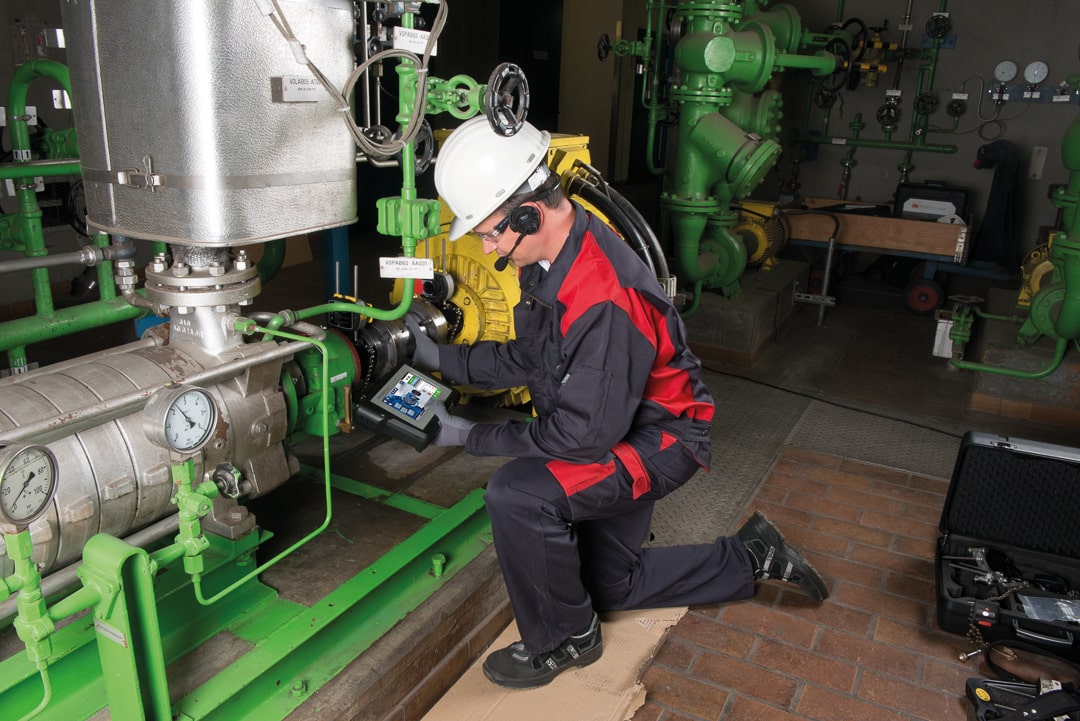
Vibration testing on rotating machines provides vital machine condition information. Here are some vibration basics:
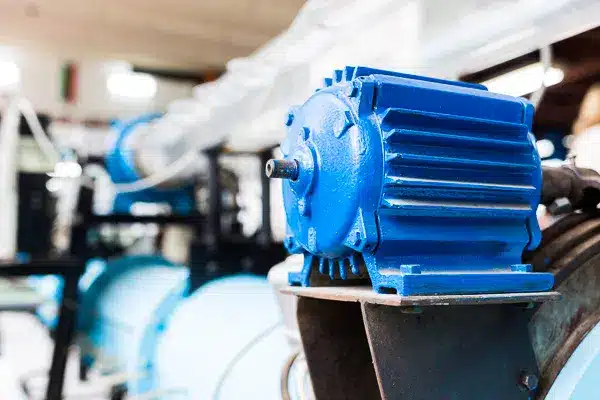
If a motor shaft turns the pump shaft at 1776 RPM for example, a heavy spot on the shaft causes an outward force in all radial directions as the shaft turns. This is like a hula hoop.
Note: Even a healthy machine will have some vibration as the shaft turns, but this is considered normal.
The sensor on top sees vibration once per revolution only in the vertical axis (in the figure below on the left). The sine wave (in the figure below on the right) shows the vertical vibration as the shaft rotates. One complete revolution of the shaft gives one complete cycle of a sine wave. The peak is when the heavy spot is at the top and the valley is when the heavy spot is at the bottom.
In Figure 1, see how RPM of the shaft = CPM of the sine wave.

Other machine components on the shaft
The rotating motor shaft turns the pump shaft through the coupling. Every time an impeller vane passes the sensor on the top, it creates a small vibration. If the pump has 10 impeller vanes, the sensor sees vibration from a vane 10 times for every shaft revolution. (The pump impeller is going the same speed as the pump shaft.) A sine wave shows 10 complete cycles.
The larger mass of the motor and pump shaft will cause more vibration amplitude (magnitude) than the impeller. The sine wave for the pump impeller vibration will be smaller in amplitude than the shaft vibration, but more cycles (10) for one complete shaft rotation. In Figure 2, see how the vibrations of the impeller vanes on the shaft equals the cycles of the sine wave.
Complex Waveforms
If we superimpose the two sine waves (shaft and pump impeller) it might look like Figure 3:
Figure 3
But really the vibrations add to each other and look more like Figure 4:
Figure 4
And 20 or 30 vibrations from different components of a real rotating machine might look like Figure 5:
Frequency (Spectrum) Analysis
The time waveform contains information about the machine, but the patterns of different components are overlapped and jumbled together to create a very complex view. A mathematical algorithm (FFT) converts the complex time waveform into a simple graph called the frequency spectrum. It separates the individual waveforms so that we can analyze them separately. This conversion is performed inside the tester.
Waveform data and spectral data is the same vibration data, just two different ways of visualizing the data.
From our earlier example, we can see how the complex waveform above on the left is made up of the two separate waveforms in the center. These can then be converted to a spectrum (in Figure 6 above), which is a simple plot of the signal’s amplitude (y–axis) against frequency (x-axis).
We see the same thing in the spectra from a real rotating machine in Figure 7 above.
- These peaks are at specific frequen- cies that represent vibrations going on in the machine. Machine diagnostics involves matching the peaks in the spectrum with events that exist in the machine.
- Spectral analysis is the primary tool we use to diagnose the condition of our rotating machines.
Conclusion
With the ability to break down complex vibration signals into simple, recognizable patterns, spectrum analysis gives us a powerful window into what’s really happening inside our machines—often before problems become visible or audible.
📖 Read Part 3 → Identifying and Interpreting Overall Vibration and Fault Patterns
Author Bio: John Bernet is a Mechanical Application and Product Specialist at Fluke Corporation. Using his 30-plus years of experience in maintenance and operation of nuclear power plants and machinery in commercial plants, John has worked with customers in all industries implementing reliability programs. He is a Certified Category II Vibration Analyst and a Certified Maintenance Reliability Professional (CMRP), with over 20 years of experience diagnosing machine faults.


