Demystifying Vibration Monitoring Part 3: Identifying and Interpreting Overall Vibration and Fault Patterns
Quick Access
Part 1: Why Vibration Monitoring Matters—And How It Works
Part 2: Vibration Analysis Principles on Rotating Machines
Part 3: Identifying and Interpreting Overall Vibration and Fault Patterns
Part 4: Diagnosing Imbalance, Misalignment, Looseness, and Bearing Wear
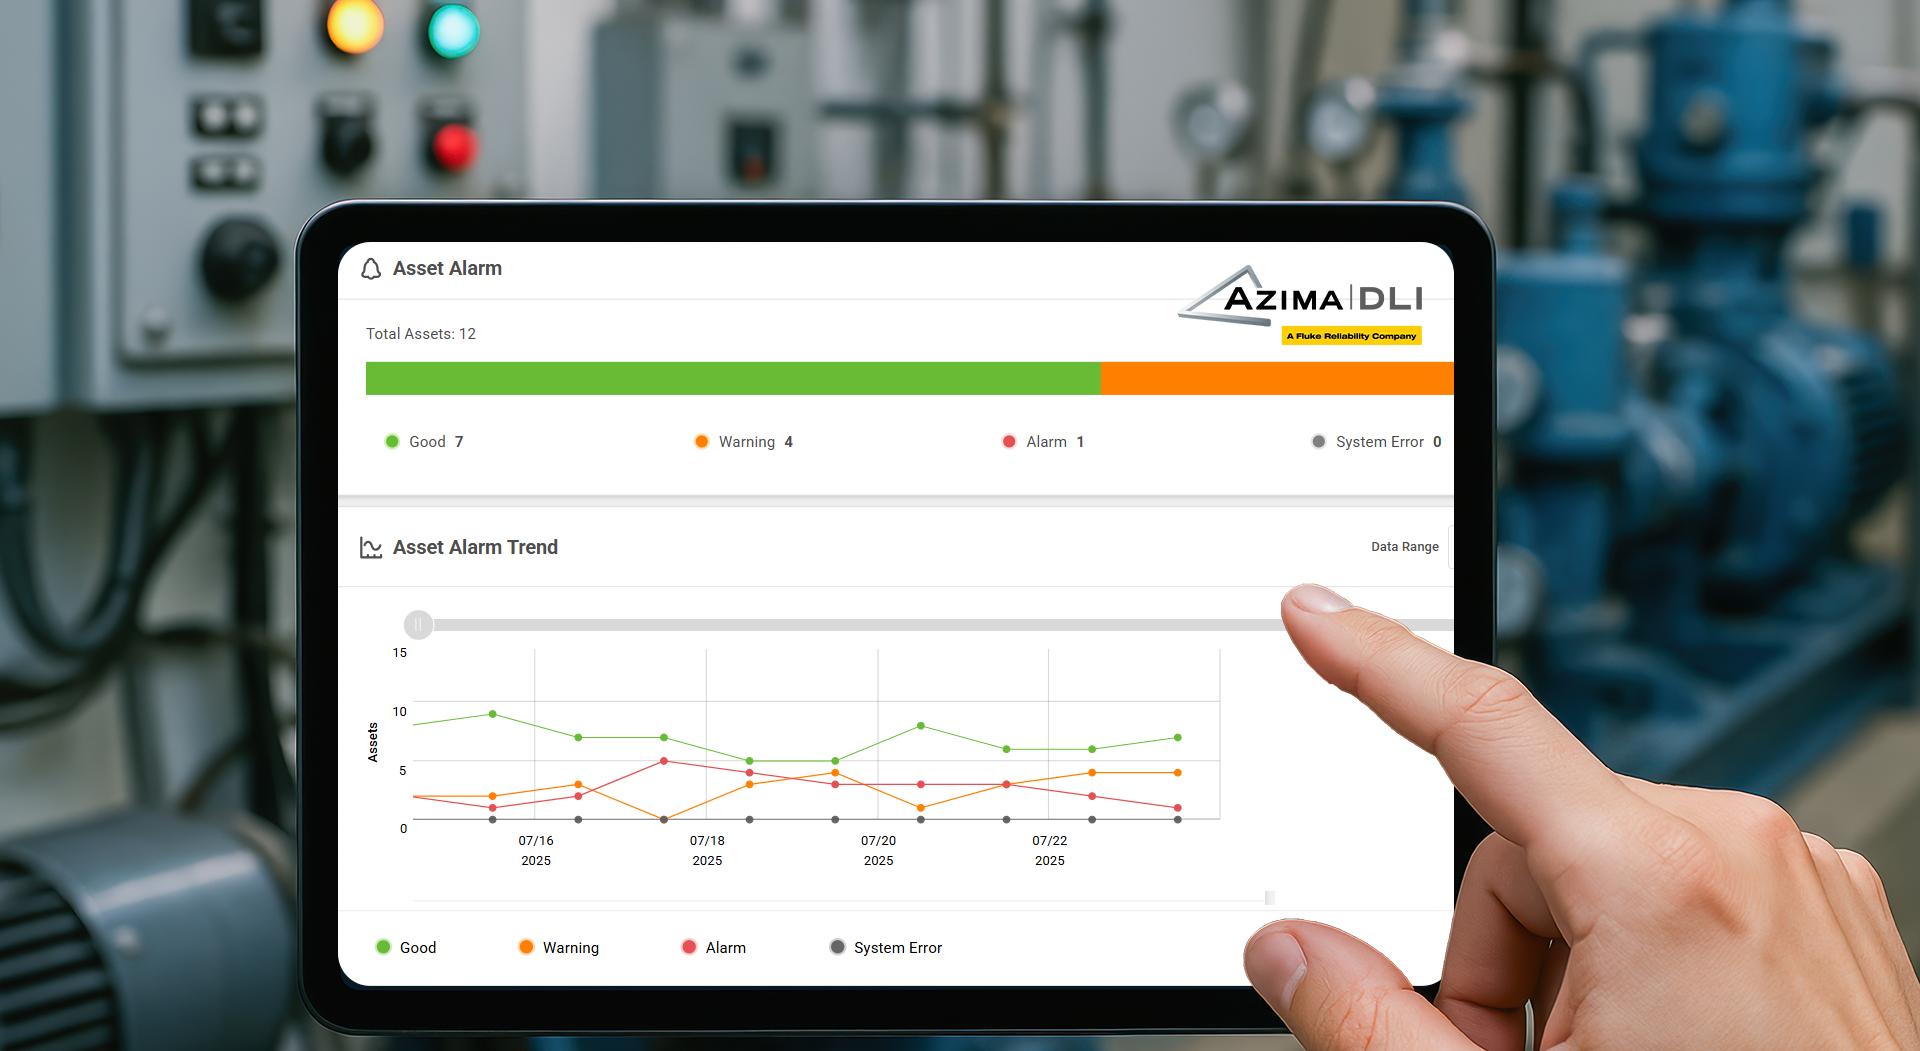
Overall Vibration (OV) analysis
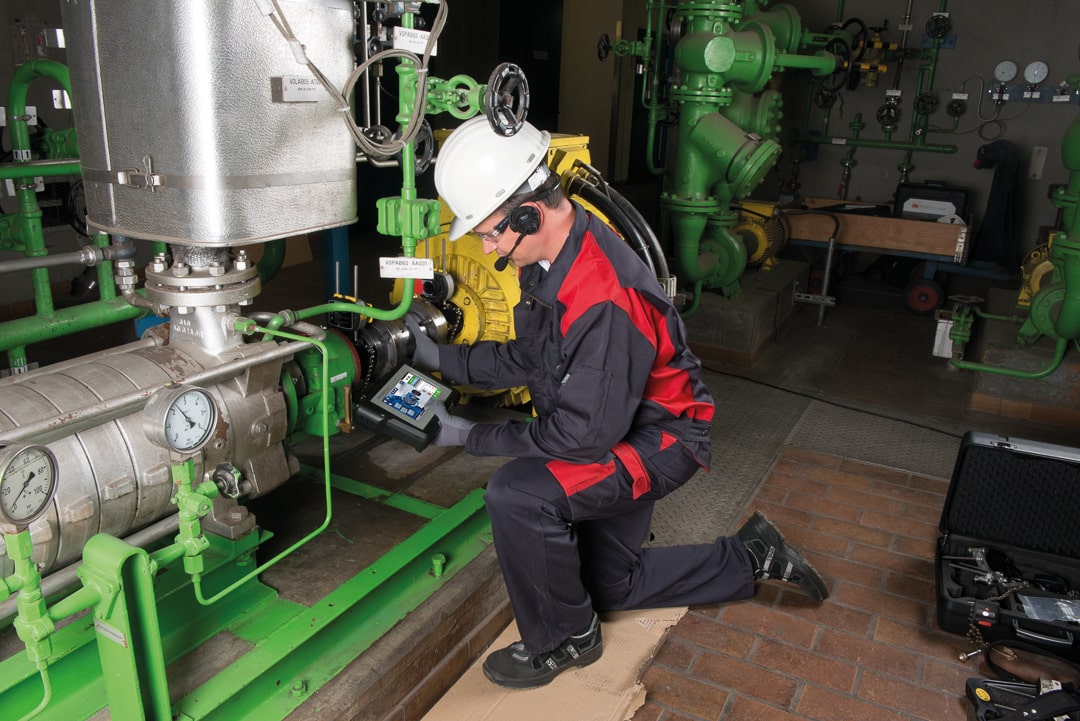
Overall vibration analysis, in contrast to spectrum analysis, is much simpler. The time domain data is used to calculate one single overall vibration value, which represents the average energy of the vibration sample. This single value can be used as an indicator of the overall health of the machine. (Note: there are multiple methods available for calculating the overall vibration value.) The benefit of overall vibration analysis is its simplicity—there is only one number to examine.
Some principles when working with the OV level include:
- A machine with “No Fault” should have a low overall vibration level.
- A high overall vibration may indicate there is another problem with the machine such as resonance, external excitation from a nearby machine, foundation, process problem, etc. Further testing may be warranted.
Analyzing Spectrum Data from Rotating Machines—3 Simple Steps
It takes years for someone to get trained to be a good vibration analyst but we only need to look at the high points to review the data such as that shown in Figure 1 below:
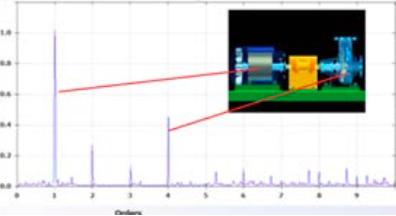
Analyzing that data is a three-step process:
- Identify vibration peaks as they relate to a source component on the machine. The largest peak typically comes from the shaft. Every rotation of shaft produces 4 vibrations from 4 impeller vanes.
- Notice the echoes of 1X peak at 2X, 3X, 4X and 6X.
- These “harmonics” are normal in all rotating machines.
- Look for patterns in data based on vibration rules
- Measure the amplitude of the vibration peak and the pattern to determine the severity of the fault.
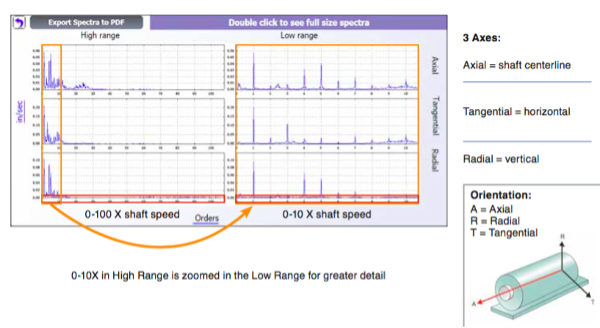
How Vibration Data is Displayed for Review of the Data
A rotating shaft moves up and down, back and forth, and axially. Measurements are taken by the vibration tester in 3 directions of shaft movement and 2 frequency ranges. This allows us to compare data between axes to determine patterns and diagnose machinery faults—provides a complete picture for diagnosis, as seen in Figure 2:
Analyzing Spectrum Data from Typical Rotating Machines
Let’s get a better handle on analyzing spectrum data from three different rotating machine configurations, resulting in different analysis models.
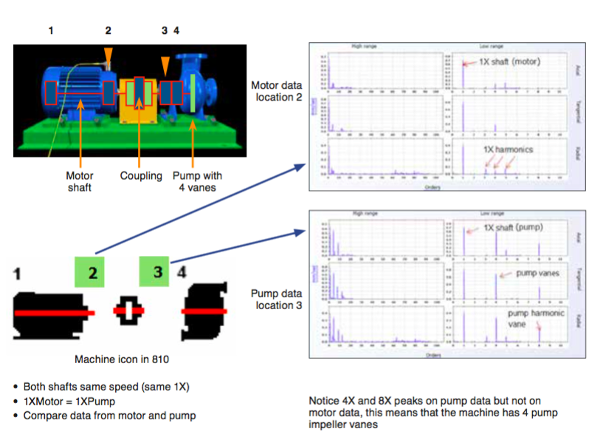
Coupled Machines
For coupled machines, take measurements from two motor bearings and two pump bearings. For small machines, measure only 1 motor bearing and 1 pump bearing, as shown in Figure 3.
Single Shaft Machines — Close Coupled
For machines that have one shaft, take measurements from just two motor bearings. For small motors, measure only one bearing, as shown in Figure 4(below). Some things to note:
- Measure from bearings only (motor ONLY)
- Pump impeller is mounted on extended motor shaft. No bearings on pump
- No data taken from pump (motor only). Still see 4X and 8X peaks from pump impeller vanes

Belt-Driven Machines (gearbox machines are similar)
With belt-driven machines, take measurements from two motor bearings and two pump bearings. For small machines, measure only one motor bearing and one pump bearing, as shown in Figure 5.

Things to Note:
- 1X motor and 1X pump harmonics seen in both motor and pump data (vibration transmits through foundation).
- Same frequency range for both locations. Overlay and compare data from both locations.
- Stronger motor harmonics in motor data and stronger pump harmonics in pump data.
- Pump vibration (four impeller vanes) are on the pump shaft: 4 X 1.1 = 4.4X; 8 X 1.1 = 8.8X.
Conclusion
Understanding overall vibration trends and how spectral patterns relate to machine configuration gives maintenance teams the foundation to diagnose issues efficiently—especially the four faults most commonly seen in rotating equipment.
📖 Read Part 4 → Diagnosing Imbalance, Misalignment, Looseness, and Bearing Wear
Author Bio: John Bernet is a Mechanical Application and Product Specialist at Fluke Corporation. Using his 30-plus years of experience in maintenance and operation of nuclear power plants and machinery in commercial plants, John has worked with customers in all industries implementing reliability programs. He is a Certified Category II Vibration Analyst and a Certified Maintenance Reliability Professional (CMRP), with over 20 years of experience diagnosing machine faults.


